Lightweight F# wrapper for gnuplot
FnuPlot is a lightweight wrapper for the gnuplot charting and visualization library, which lets you create cross-platform, publication-quality charts on Mac, Linux and Windows. FnuPlot provides two features on top of gnuplot:
First, it hides the gnuplot process, so you do not have to start and control the process. You can easily starts
gnuplotin the background just by creating a new instance of theGnuPlottype. Then you can send commands tognuploteasily using theSendCommandmethod.Second, FnuPlot implements a simple domain-specific language for building a number of common chart types. This means that you can use
gp.Plotto plot charts for functions, line charts, histograms and a few other charts and you can usegp.Setto configuregnuplot.
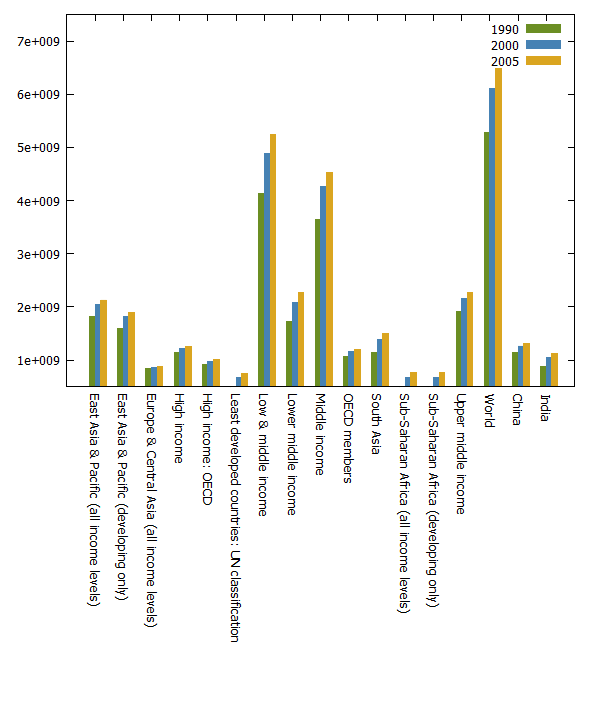
Visualizing population of the world
To give see a quick example of the DSL for building gnuplot charts, have a look at the following
example from the [visualizing population using WorldBank data] tutorial. The tutorial downloads
data from the WorldBank and then uses FnuPlot to create a single chart combining three histograms
for three different years:
1: 2: 3: 4: 5: 6: 7: 8: 9: 10: 11: 12: 13: 14: 15: 16: 17: |
// Starts 'gnuplot' process interactively #r "FnuPlot.dll" open FnuPlot let gp = new GnuPlot() // Configure chart style, ranges and titles gp.Set ( style = Style(Solid), range = RangeY.[ 5e8 .. 75e8 ], titles = Titles(x = names, xrotate = -90) ) // Create a chart combining several histograms [ for year, values, color in stats -> Series.Histogram ( data = values, title = string year, lineColor = color) ] |> gp.Plot |
The example first creates GnuPlot (assuming that the executable is in your PATH). Then it calls
gp.Set to configure the chart, setting the Y axis range and titles. Then it creates a sequence of
histograms (with different line colours) that are then passed to gp.Plot to display the plot. The
resulting chart looks as follows:
How to get FnuPlot
The library is available as FnuPlot on NuGet. To get the code also, get the code from GitHub.
All of the FnuPlot functionality is currently implemented in a single file, and so you can also copy the
FnuPlot.fsfile to your project. The recommended way to do this is to use Paket for managing your references and use GitHub reference specified in yourpaket.dependenciesfile usinggithub fsprojects/FnuPlot src/FnuPlot/FnuPlot.fs.
Samples & documentation
The FnuPlot library comes with a documentation that is automatically generated from *.fsx files in
the content folder. This means that you can also open the code in your favourite F# editor
and run it interactively.
Read the Getting started tutorial, which contains more detailed description of different charts supported by the library. The Visualizing population using WorldBank tutorial shows how to create the chart above.
API Reference contains automatically generated documentation for all types, modules and functions in the library. This includes additional brief samples on using most of the functions.
Contributing and copyright
The project is hosted on GitHub where you can report issues, fork the project and submit pull requests. If you're adding a new public API, please also consider adding samples that can be turned into a documentation.
The library is available under Apache 2.0 license, which allows modification and redistribution for both commercial and non-commercial purposes. For more information see the License file in the GitHub repository.
Full name: Index.names
Full name: Index.stats
Full name: Index.gp
type GnuPlot =
interface IDisposable
new : ?path:string -> GnuPlot
private new : actualPath:string -> GnuPlot
member private Dispose : disposing:bool -> unit
override Finalize : unit -> unit
member Plot : data:seq<Series> * ?style:Style * ?range:Range * ?output:Output * ?titles:Titles -> unit
member Plot : data:Series * ?style:Style * ?range:Range * ?output:Output * ?titles:Titles -> unit
member Plot : func:string * ?style:Style * ?range:Range * ?output:Output * ?titles:Titles -> unit
member SendCommand : str:string -> unit
member Set : ?style:Style * ?range:Range * ?output:Output * ?titles:Titles * ?TimeFormatX:TimeFormatX -> unit
...
Full name: FnuPlot.GnuPlot
--------------------
new : ?path:string -> GnuPlot
type Style =
interface ICommand
new : ?fill:FillStyle -> Style
Full name: FnuPlot.Style
--------------------
new : ?fill:FillStyle -> Style
Full name: FnuPlot.Ranges.RangeY
type Titles =
interface ICommand
new : ?x:string list * ?xrotate:int * ?y:string list * ?yrotate:int -> Titles
Full name: FnuPlot.Titles
--------------------
new : ?x:string list * ?xrotate:int * ?y:string list * ?yrotate:int -> Titles
type Series =
new : plot:SeriesType * data:Data * ?title:string * ?lineColor:Color * ?weight:int * ?fill:FillStyle -> Series
member Command : string
member Data : Data
static member Histogram : data:seq<float> * ?title:string * ?lineColor:Color * ?weight:int * ?fill:FillStyle -> Series
static member Impulses : data:seq<DateTime * float> * ?title:string * ?lineColor:Color * ?weight:int -> Series
static member Impulses : data:string * ?title:string * ?lineColor:Color * ?weight:int -> Series
static member Impulses : data:seq<float * float> * ?title:string * ?lineColor:Color * ?weight:int -> Series
static member Impulses : data:seq<float> * ?title:string * ?lineColor:Color * ?weight:int -> Series
static member Lines : data:seq<DateTime * float> * ?title:string * ?lineColor:Color * ?weight:int -> Series
static member Lines : data:string * ?title:string * ?lineColor:Color * ?weight:int -> Series
...
Full name: FnuPlot.Series
--------------------
new : plot:SeriesType * data:Data * ?title:string * ?lineColor:System.Drawing.Color * ?weight:int * ?fill:FillStyle -> Series
val string : value:'T -> string
Full name: Microsoft.FSharp.Core.Operators.string
--------------------
type string = System.String
Full name: Microsoft.FSharp.Core.string
member GnuPlot.Plot : data:Series * ?style:Style * ?range:Internal.Range * ?output:Output * ?titles:Titles -> unit
member GnuPlot.Plot : func:string * ?style:Style * ?range:Internal.Range * ?output:Output * ?titles:Titles -> unit
