Getting started with FnuPlot
FnuPlot is a lightweight wrapper for the gnuplot charting and visualization library. Since gnuplot is cross-platform (works on Mac, Linux and Windows), you can use this library on all of the platforms mentioned above.
FnuPlot provides two features on top of gnuplot. First, it hides the gnuplot process, so you
do not have to start and control the process; you can use the GnuPlot type and call it using
SendCommand. Second, FnuPlot implements a simple domain-specific language for building a
number of common chart types.
Installing and configuring FnuPlot
Install gnuplot if you haven't already.
The library is available as FnuPlot on NuGet. To get the code also, get the code from GitHub.
Alternatively: Because FnuPlot is implemented in a single source file, you can instead just copy the
FnuPlot.fsfile into your project. A robust way to do this is to use Paket for managing your references and use GitHub reference specified in yourpaket.dependenciesfile usinggithub fsprojects/FnuPlot src/FnuPlot/FnuPlot.fs.- Once you have the reference, you can either add
FnuPlot.dllto your reference (when using a compiled project) or use#load "FnuPlot.fs"to load the FnuPlot file obtained using Paket. Alternatively, you can use#rif you're referencing FnuPlot using NuGet package:
1: 2: 3: 4: |
#r "FnuPlot.dll" open FnuPlot open System open System.Drawing |
The access to gnuplot is managed through the GnuPlot type. When creating an instance, you
can specify the path to the gnuplot executable. If you do not pass a path explicitly, then
FnuPlot assumes that you have gnuplot in your PATH variable:
1: 2: |
let gp_default = new GnuPlot() let gp = new GnuPlot(path) |
The Set method on the GnuPlot object provides a way to configure gnuplot. Here, we specify
that plots should appear in a new window (using X11) and we also specify the default font:
1:
|
gp.Set(output = Output(X11, font="arial")) |
Plotting functions and line charts
The Plot method provided by GnuPlot has a number of overloads. You can specify a function
to be drawn (as a string), you can specify a single data series or you can specify multiple
series (which can also use different chart types).
The following shows how to call Plot with a function specified as a string:
1:
|
gp.Plot(Series.Lines "sin(x)") |
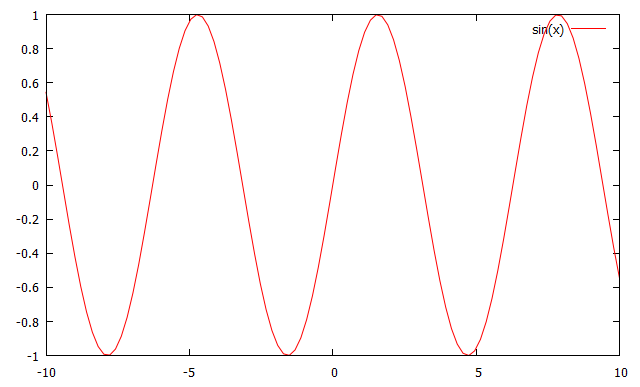
This creates a chart with a single series, created (implicitly) by specifying the function
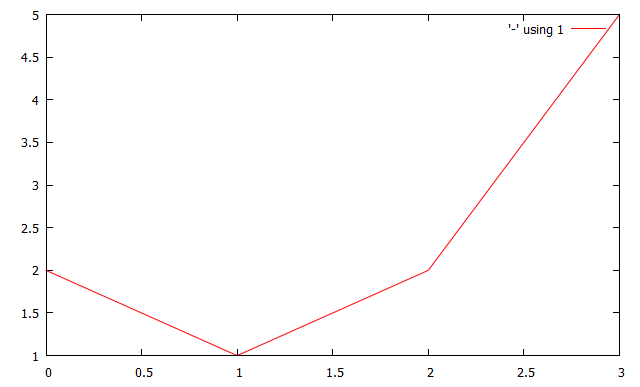
as a string. If you want to create other kinds of series, you need to use the Series type.
The following uses Series.Lines to create a single line chart from a specified list of
data points:
1:
|
gp.Plot(Series.Lines [2.0; 1.0; 2.0; 5.0]) |
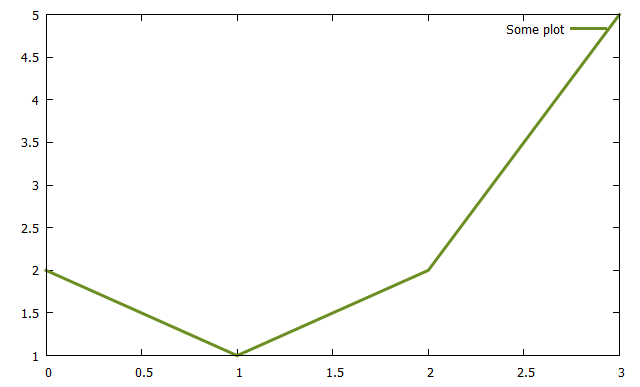
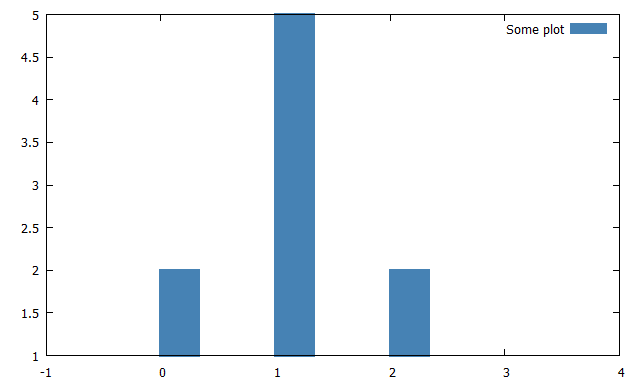
The Series.Lines method takes a number of optional parameters that you can use to specify
the title, colour and other properties of the line chart. You can also make the call using
the pipelining operator:
1: 2: 3: 4: |
Series.Lines ( title="Some plot", lineColor = Color.OliveDrab, weight = 3, data = [2.0; 1.0; 2.0; 5.0]) |> gp.Plot |
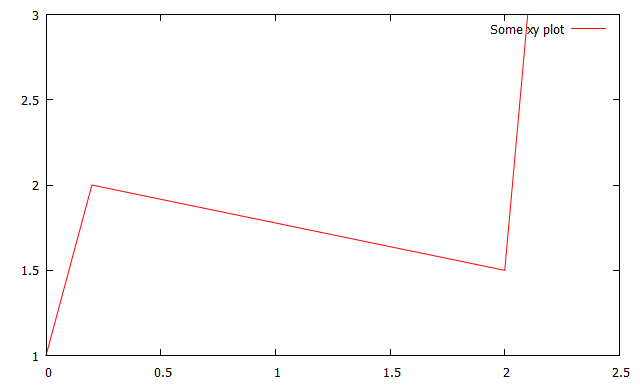
When creating a line series from data points consisting of both X and Y values, you can also use
the Series.Lines method with a series of that type (note that FnuPlot also supports time-series data sets, which are
discussed below).
1: 2: |
Series.Lines( [0.0,1.0; 0.2,2.0; 2.0,1.5; 2.1,3.0] , title = "Some xy plot") |> gp.Plot |
Plotting histograms and time-series
Another kind of chart for which FnuPlot provides an easy-to-use wrapper is histogram. This can
be created using the Series.Histogram function. Again, we can specify additional properties
using a number of optional parameters:
1: 2: 3: 4: |
Series.Histogram ( [2.0; 5.0; 2.0; 1.0], title = "Some plot", fill = Solid, lineColor = Color.SteelBlue, weight = 3) |> gp.Plot |
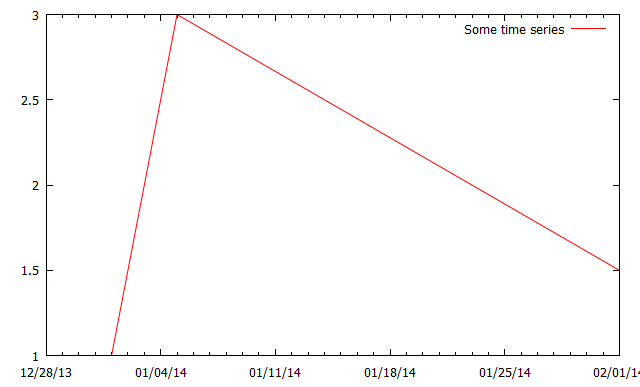
As already mentioned, FnuPlot also supports time-series charts. These can be created by passing
values as pairs of DateTime and float:
1: 2: 3: 4: 5: 6: 7: |
let values = [ DateTime(2014,1,1), 1.0 DateTime(2014,1,5), 3.0 DateTime(2014,2,1), 1.5 ] Series.Lines(values, title = "Some time series" ) |> gp.Plot |
Combining multiple chart series
As mentioned earlier, the Plot function has a number of overloads. We have already
seen an overload that takes a string (to plot a specified function) and an overload that
takes a single series. However, you can also call Plot with a collection of series.
In that case, gnuplot will render multiple series into a single chart.
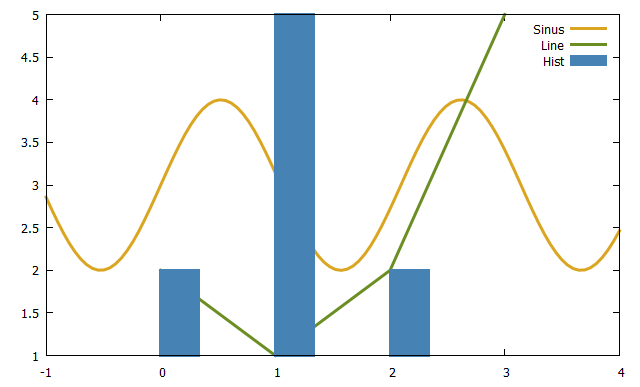
The following (slightly silly) demo combines the sin(x*3)+3) function specified as
a string together with line chart and histogram created from values:
1: 2: 3: 4: 5: 6: 7: 8: 9: 10: |
[ Series.Lines ( "sin(x*3) + 3", title = "Sinus", lineColor = Color.Goldenrod, weight = 3) Series.Lines ( [2.0; 1.0; 2.0; 5.0], title = "Line", lineColor = Color.OliveDrab, weight = 3) Series.Histogram ( [2.0; 5.0; 2.0; 1.0], title = "Hist", fill = Solid, lineColor = Color.SteelBlue, weight = 3) ] |> gp.Plot |
Configuring ranges and styles
So far, we always specified properties of individual chart series locally using optional
parameters of a Series.<Some> method. However, the gp.Plot method also takes a number
of additional parameters that can be used to specify properties of the whole chart. Most
importantly, you can use these to specify ranges:
1: 2: 3: |
gp.Plot( range = RangeY.[-10.0 .. 10.0 ], data = Series.Lines [2.0; 1.0; 2.0; 5.0]) |
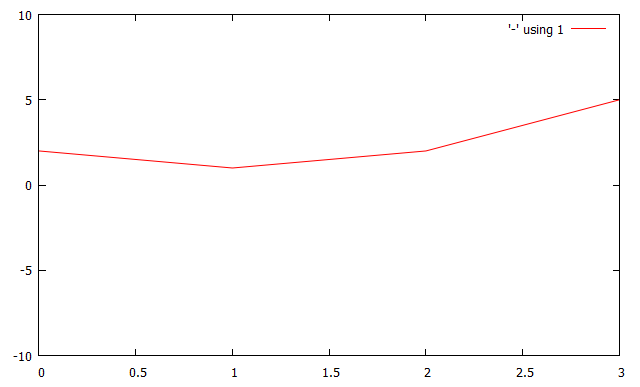
To specify a range, you can use RangeY (as shown in the code snippet) or RangeX to set
the range for one of the two axes. If you want to configure both ranges, you can use the
Range type. For example, to specify X axis range from -10 to 10 and Y axis range from
-1 to 1, you can write Range.[-10.0 .. 10.0, -1.0 .. 1.0].
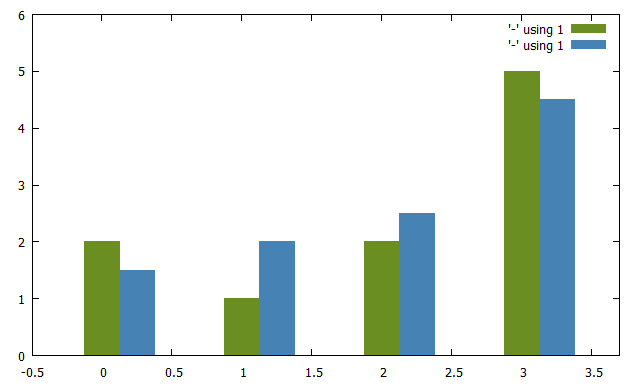
The next example shows how to specify fill style for the whole chart, so that you do not have to repeat this for every single histogram that is being combined:
1: 2: 3: 4: 5: 6: |
gp.Plot( style = Style(fill=Solid), range = Range.[-0.5 .. 3.7, 0.0 .. 6.0], data = [ Series.Histogram([2.0; 1.0; 2.0; 5.0], lineColor = Color.OliveDrab) Series.Histogram([1.5; 2.0; 2.5; 4.5], lineColor = Color.SteelBlue) ]) |
Saving charts to a file
At the beginning of the tutorial, we used the gp.Set method to specify the output kind for
gnuplot. We used Output(X11, font="arial") to use the X11 server, which means that all
charts are created in a gnuplot window.
If you want to save charts to a file, then you can use the Png output. The following
(slightly longer) example also demonstrates other optional parameters of the gp.Set
method. This gives you another way to specify the range and style - this time, the configuration
will apply to all created charts:
1: 2: 3: 4: 5: 6: 7: 8: 9: 10: 11: 12: |
// Set global properties using the 'Set' method gp.Set(style = Style(fill = Solid), range = Range.[-0.5 .. 3.7, 0.0 .. 6.0]) // Specify the 'Png' output kind gp.Set(output = Output(Png("/home/tomas/Temp/test1.png"))) // Create a plot (which will be saved to a file) gp.Plot [ Series.Histogram([2.0; 1.0; 2.0; 5.0], lineColor = Color.OliveDrab) Series.Histogram([1.5; 2.0; 2.5; 4.5], lineColor = Color.SteelBlue) ] // Reset the configuration back to X11 plots gp.Set(output = Output(X11, font="arial")) |
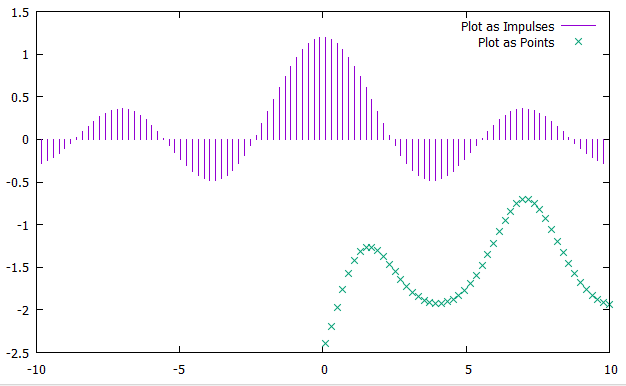
Impulses and Points
Using the Series.Impulses and Series.Points methods we can plot impulses and points.
1: 2: 3: |
[ Series.Impulses( "besj0(x)*0.12e1", title = "Plot as Impulses") Series.Points( "(x**besj0(x))-2.5", title = "Plot as Points")] |> gp.Plot |
Full name: Tutorial.pathOpt
from Microsoft.FSharp.Collections
Full name: Microsoft.FSharp.Collections.Seq.tryFind
static member AppendAllLines : path:string * contents:IEnumerable<string> -> unit + 1 overload
static member AppendAllText : path:string * contents:string -> unit + 1 overload
static member AppendText : path:string -> StreamWriter
static member Copy : sourceFileName:string * destFileName:string -> unit + 1 overload
static member Create : path:string -> FileStream + 3 overloads
static member CreateText : path:string -> StreamWriter
static member Decrypt : path:string -> unit
static member Delete : path:string -> unit
static member Encrypt : path:string -> unit
static member Exists : path:string -> bool
...
Full name: System.IO.File
Full name: Tutorial.path
Full name: Microsoft.FSharp.Core.Operators.defaultArg
Full name: Tutorial.gp_default
type GnuPlot =
interface IDisposable
new : ?path:string -> GnuPlot
private new : actualPath:string -> GnuPlot
member private Dispose : disposing:bool -> unit
override Finalize : unit -> unit
member Plot : data:seq<Series> * ?style:Style * ?range:Range * ?output:Output * ?titles:Titles -> unit
member Plot : data:Series * ?style:Style * ?range:Range * ?output:Output * ?titles:Titles -> unit
member Plot : func:string * ?style:Style * ?range:Range * ?output:Output * ?titles:Titles -> unit
member SendCommand : str:string -> unit
member Set : ?style:Style * ?range:Range * ?output:Output * ?titles:Titles * ?TimeFormatX:TimeFormatX -> unit
...
Full name: FnuPlot.GnuPlot
--------------------
new : ?path:string -> GnuPlot
Full name: Tutorial.gp
type Output =
interface ICommand
new : output:OutputType * ?font:string -> Output
Full name: FnuPlot.Output
--------------------
new : output:OutputType * ?font:string -> Output
member GnuPlot.Plot : data:Series * ?style:Style * ?range:Internal.Range * ?output:Output * ?titles:Titles -> unit
member GnuPlot.Plot : func:string * ?style:Style * ?range:Internal.Range * ?output:Output * ?titles:Titles -> unit
type Series =
new : plot:SeriesType * data:Data * ?title:string * ?lineColor:Color * ?weight:int * ?fill:FillStyle -> Series
member Command : string
member Data : Data
static member Histogram : data:seq<float> * ?title:string * ?lineColor:Color * ?weight:int * ?fill:FillStyle -> Series
static member Impulses : data:seq<DateTime * float> * ?title:string * ?lineColor:Color * ?weight:int -> Series
static member Impulses : data:string * ?title:string * ?lineColor:Color * ?weight:int -> Series
static member Impulses : data:seq<float * float> * ?title:string * ?lineColor:Color * ?weight:int -> Series
static member Impulses : data:seq<float> * ?title:string * ?lineColor:Color * ?weight:int -> Series
static member Lines : data:seq<DateTime * float> * ?title:string * ?lineColor:Color * ?weight:int -> Series
static member Lines : data:string * ?title:string * ?lineColor:Color * ?weight:int -> Series
...
Full name: FnuPlot.Series
--------------------
new : plot:SeriesType * data:Data * ?title:string * ?lineColor:Color * ?weight:int * ?fill:FillStyle -> Series
static member Series.Lines : data:string * ?title:string * ?lineColor:Color * ?weight:int -> Series
static member Series.Lines : data:seq<float * float> * ?title:string * ?lineColor:Color * ?weight:int -> Series
static member Series.Lines : data:seq<float> * ?title:string * ?lineColor:Color * ?weight:int -> Series
struct
member A : byte
member B : byte
member Equals : obj:obj -> bool
member G : byte
member GetBrightness : unit -> float32
member GetHashCode : unit -> int
member GetHue : unit -> float32
member GetSaturation : unit -> float32
member IsEmpty : bool
member IsKnownColor : bool
...
end
Full name: System.Drawing.Color
Full name: Tutorial.values
type DateTime =
struct
new : ticks:int64 -> DateTime + 10 overloads
member Add : value:TimeSpan -> DateTime
member AddDays : value:float -> DateTime
member AddHours : value:float -> DateTime
member AddMilliseconds : value:float -> DateTime
member AddMinutes : value:float -> DateTime
member AddMonths : months:int -> DateTime
member AddSeconds : value:float -> DateTime
member AddTicks : value:int64 -> DateTime
member AddYears : value:int -> DateTime
...
end
Full name: System.DateTime
--------------------
DateTime()
(+0 other overloads)
DateTime(ticks: int64) : unit
(+0 other overloads)
DateTime(ticks: int64, kind: DateTimeKind) : unit
(+0 other overloads)
DateTime(year: int, month: int, day: int) : unit
(+0 other overloads)
DateTime(year: int, month: int, day: int, calendar: Globalization.Calendar) : unit
(+0 other overloads)
DateTime(year: int, month: int, day: int, hour: int, minute: int, second: int) : unit
(+0 other overloads)
DateTime(year: int, month: int, day: int, hour: int, minute: int, second: int, kind: DateTimeKind) : unit
(+0 other overloads)
DateTime(year: int, month: int, day: int, hour: int, minute: int, second: int, calendar: Globalization.Calendar) : unit
(+0 other overloads)
DateTime(year: int, month: int, day: int, hour: int, minute: int, second: int, millisecond: int) : unit
(+0 other overloads)
DateTime(year: int, month: int, day: int, hour: int, minute: int, second: int, millisecond: int, kind: DateTimeKind) : unit
(+0 other overloads)
Full name: FnuPlot.Ranges.RangeY
type Style =
interface ICommand
new : ?fill:FillStyle -> Style
Full name: FnuPlot.Style
--------------------
new : ?fill:FillStyle -> Style
Full name: FnuPlot.Ranges.Range
static member Series.Impulses : data:string * ?title:string * ?lineColor:Color * ?weight:int -> Series
static member Series.Impulses : data:seq<float * float> * ?title:string * ?lineColor:Color * ?weight:int -> Series
static member Series.Impulses : data:seq<float> * ?title:string * ?lineColor:Color * ?weight:int -> Series
static member Series.Points : data:string * ?title:string * ?lineColor:Color * ?weight:int -> Series
static member Series.Points : data:seq<float * float> * ?title:string * ?lineColor:Color * ?weight:int -> Series
static member Series.Points : data:seq<float> * ?title:string * ?lineColor:Color * ?weight:int -> Series
